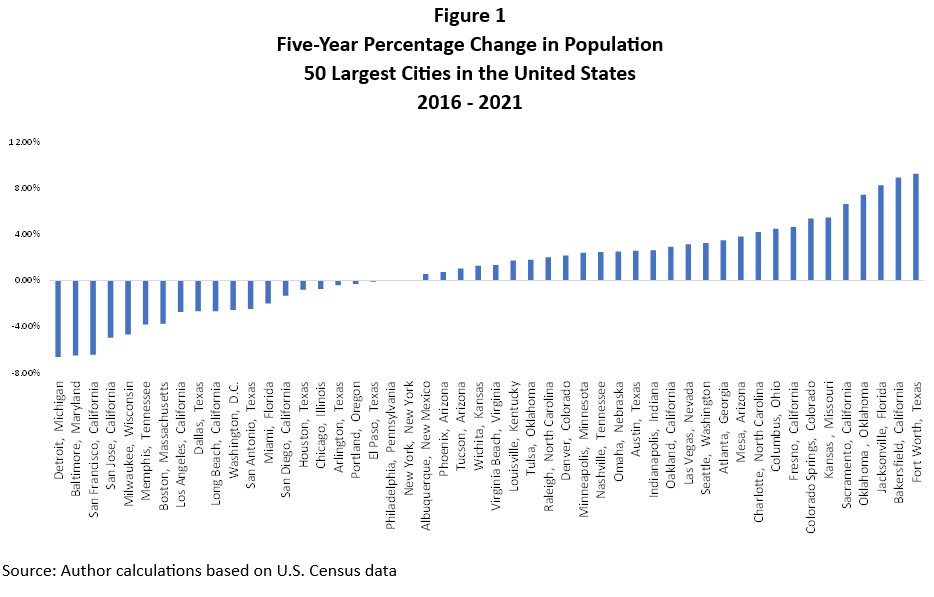
The movement away from large cities is not universal, however. People may be leaving Los Angeles, but they are moving to Fort Worth, Atlanta and Las Vegas. Figure 1 presents the diverse five-year percentage change in population for the 50 largest cities in the United States. The vast differences in the five-year population change between these cities raise the obvious question: Why are people flocking to some cities while they desert others?

People choose to live in a city for many reasons including economic opportunities, quality of life, crime rate, social amenities (e.g., theater, museums, professional sports teams), taxes, cost of living and the climate. While a city’s climate is relatively fixed, many of the other attributes will, in large part, reflect the consequences of state and local public policies.
People value these attributes differently, of course. Further, some places offer unique benefits that will encourage people to endure costs that they are unwilling to bear in other locales. For instance, some people are willing to endure worse traffic and higher taxes to enjoy San Diego’s beautiful weather but would be unwilling to tolerate these problems if the city’s climate were less pleasant.
It stands to reason, consequently, that people’s sensitivity toward negative attributes such as high taxes or declining affordability will vary by location. Yet all locations have a tipping point. When policies increase taxes, raise residents’ costs of living, and/or diminish economic opportunities beyond what residents are willing to endure, then people will migrate away from the city.
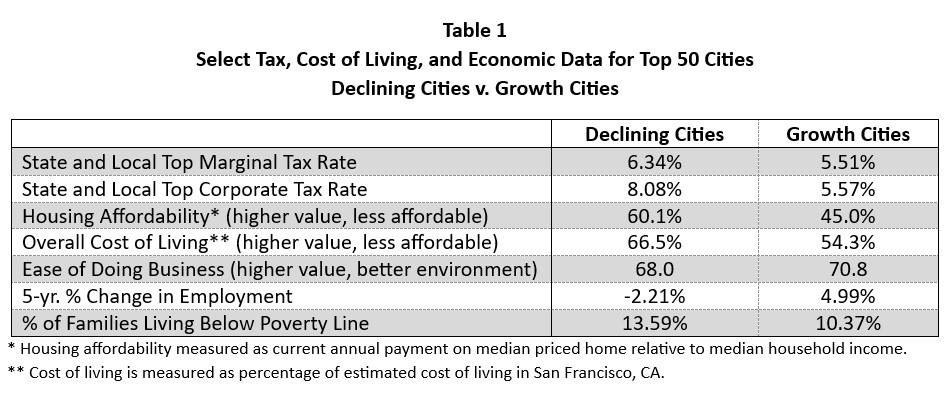
The data bear out this connection. See Table 1.
Table 1 categorizes the top 50 cities displayed in Figure 1 into those with declining populations and those with growing populations. The data demonstrate that the cities with declining populations impose higher income taxes, have less affordable housing and have higher costs of living compared to the cities with growing populations. As for the economic outcomes, the declining cities also have a declining employment market and a larger share of the population living in poverty.

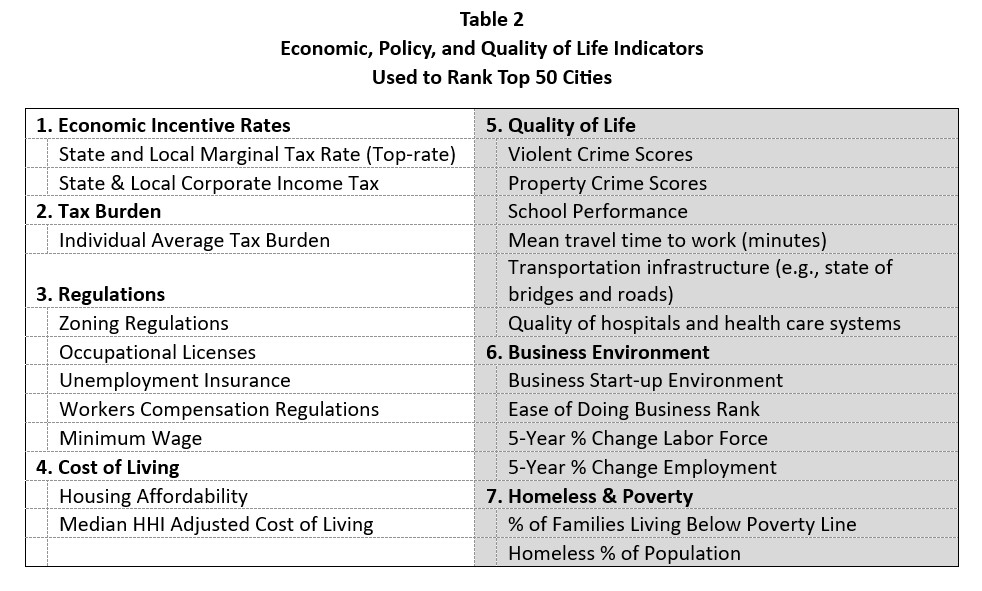
The forthcoming Pacific Research Institute paper, The City Competitive Index, ranks the nation’s 50 largest cities based on policy and quality-of-life indicators to provide an in-depth comparison of the local policy environment in the 50 largest cities in the United States. PRI evaluated these cities based on a wide array of economic, policy and quality-of-life indicators summarized in Table 2. We grouped the seven indicators into seven broad categories that include:
- The economic incentive rates, which measure the incentive to make additional economic investments by individuals and businesses.
- The tax burden, which measures the average amount of taxes paid by people living in the state.
- Regulations, which measure how burdensome are key local regulations.
- Cost of living, which measures how expensive it is to own a home or purchase everyday goods and services in the city.
- Quality of life, which measures the attributes that people desire when choosing a place to live.
- Business environment, which measures the costs and burdens created by state and local policies on operating a business as well as the health of the employment markets.
- Homelessness and poverty, which measure how pervasive these key problems are in the local area.

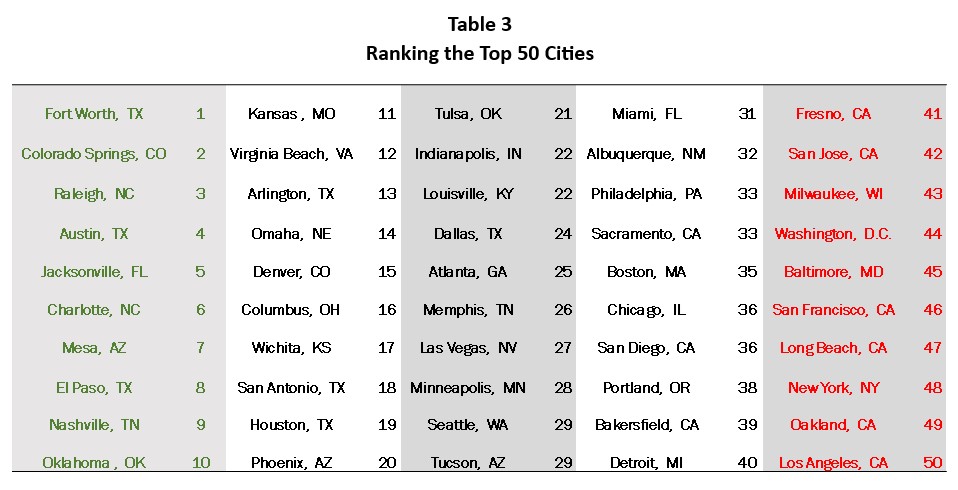
The overall rank for each state was the average of each state’s rank within each of the seven broad categories. The state rank for each broad category is the sum of its rank across all the underlying indicators. As Table 3 illustrates, the top competitive cities are Forth Worth, Texas (1), Colorado Springs, Colo. (2), Raleigh N.C. (3), Austin, Texas (4) and Jacksonville, Fla. (5). The least competitive cities are San Francisco (46), Long Beach, Calif. (47), New York City (48), Oakland, Calif. (49), and Los Angeles (50).

Comparing the rankings to key economic and population trends confirm that people choose to live in the top-ranked cities, which offer residents an affordable place to live, growing economic opportunity and a higher quality of life. Alternatively, the rankings confirm that people are leaving the bottom-ranked cities that fail to secure these environments for their residents.
These results indicate that for those cities losing residents, the path to stem the urban exodus is clear – improve the policy environment to encourage economic opportunity, improve the quality of life and remove the policies driving their affordability problems.
Wayne Winegarden, Ph.D., is a Sr. Fellow in Business and Economics and the Director of the Center for Medical Economics and Innovation at the Pacific Research Institute.

