
Newsom, in turn, called out the murder rates in each of the lawmakers’ home states, proclaiming that Alabama had “…3X the murder rate of California”, Oklahoma had a murder rate “…40 % higher than California’s” and Arkansas was “literally DOUBLE California’s”.
In order for Newsom’s posts on X to be mathematically correct, he would have had to have used the figure of 1,892 homicides reported in the annually published Homicides in California 2023 edition from the California Department of Justice (DOJ), which represent a homicide rate of 4.2 per 100,000 when adjusted for population.
In fact, 1,929 homicides were reported by California law enforcement agencies to the FBI that were not reported to California DOJ, including data from the San Jose Police Department (27 homicides), the city of Orange Police Department (3), and the Montebello Police Department (5).
This means that, according to the FBI, California’s homicide rate is actually 4.95 per 100,000. Still lower than Alabama, where the homicide rate was 10 per 100,000 with 524 victims; Oklahoma, it was 6.1 per 100,000 with 247 victims; and Arkansas, it was 9 per 100,000, with 289 victims.
Newsom is quoting his own state’s incomplete DOJ statistics while using the FBI statistics for Alabama, Oklahoma, and Arkansas.
But even this doesn’t tell the entire story.
Some Background
Homicides represent a reliable crime statistic as, due to the nature of the crime and the presence of a deceased victim, dependability is nearly 100 percent. Although tolling of crimes may not align with the calendar year. For example, a body discovered in 2023 may have been murdered in 2022 and an investigation may not discover that until statistics have already been submitted.
Most other categories of crime statistics depend on a report from a victim or a witness, which leads to significant underreporting. That’s why official crime statistics are what the FBI calls “offenses known to law enforcement” given they are based on both the voluntary reports of crime victims as well as discretionary submission of statistics by state and local law enforcement agencies.
For a more complete picture of crime, researchers also look at data from state Departments of Justice; the U.S. Centers for Disease Control, the Bureau of Justice Statistics, criminal justice advocacy organizations, pollsters, universities, and public policy think tanks.
Data must also be put into the context of current events. A mass casualty event, such as 9/11 when 2,753 people were killed in New York City, can skew a state’s otherwise low crime statistics for that year.
Political careers can rise or fall based on crime statistics.
Which brings us back to Newsom’s crime data feud with red state politicians.
Crime in California
In fact, no one really knows how much crime is committed in California by individuals who are in the state illegally, because under state law (SB 54, the “California Values Act” or sanctuary state law) prohibits collecting those statistics.
Pulling in more sources of data, however, we can piece together a picture of how California stacks up against the other 49 states and the District of Columbia.
In 2023, the last full year statistics are available (the 2024 statistics will be released July 1, 2025), California’s violent crime rates were increasing. According to the California Department of Justice, violent crime rates rose 15.1 percent from 2018 to 2023 and 3.3 percent from 2022 to 2023. However, 28 jurisdictions failed to contribute statistics to DOJ. San Jose Police Department data alone would have added the 27 homicides already mentioned, 3,782 aggravated assaults, just under 1000 robberies, and over 650 rapes.
According to the Council of State Governments, this data places California among the 17 states and Washington, DC that, from 2019-2023, had increasing crime rates.
The chart below shows 4 year increasing crime rates for several key states including California, where the violent crime rate grew 15 percent. In the West, the states of Washington (18 percent), Oregon (11 percent), and Colorado (23 percent). They, along with Virginia and the District of Columbia reported the biggest increases in violent crime.
The remaining 33 states have declining crime rates, with the largest declines coming in Hawaii (29 percent decline) and New Hampshire (32 percent decline). For those following the X debate, Oklahoma declined 5 percent and Alabama declined 20 percent.
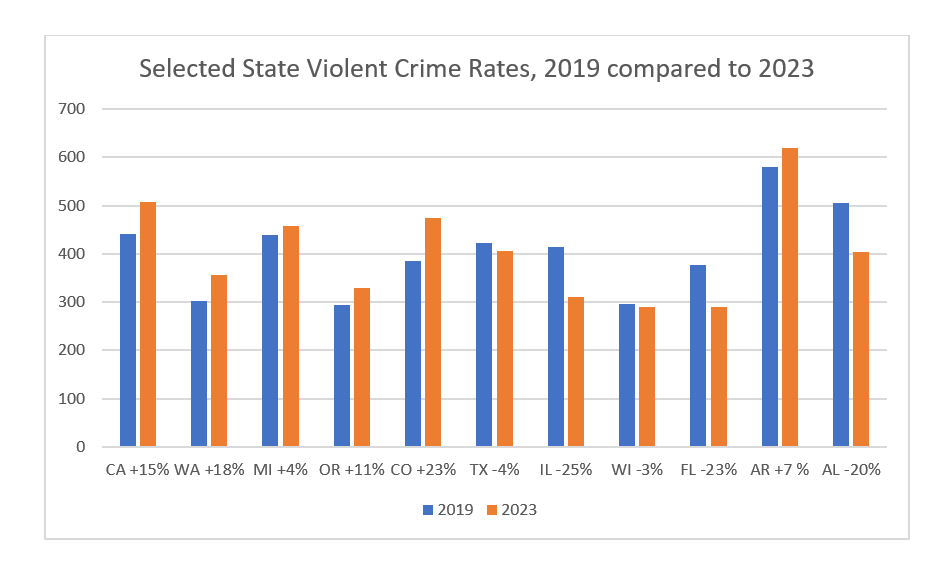
Source: Council of State Governments
Thankfully, there has been no 9/11 in 25 years and the more recent event attributed to rising crime was the phenomenon of the Covid -19 pandemic, which affected each state more or less equally.
We are left to conclude then that differences in the various state crime rates are a function of demographics and public policy. And in that area, California with 1 million reported crimes and nearly 198,000 violent crime victims who were not the victims of a homicide, is third from the bottom.
Steve Smith is a senior fellow in urban studies at the Pacific Research Institute, focusing on California’s growing crime problem.