
California’s 10 biggest cities are lagging state housing goals
By John Seiler | October 30, 2026
California has spent more than a decade trying to solve its housing shortage. In 2024 alone, Gov. Gavin Newsom signed more than 60 housing laws. In 2025 it was more than 50. And, for 2026, a September 29 list from the governor’s office named at least 34.
A key metric is each city’s Regional Housing Needs Allocation. The California Department of Housing and Community Development (HCD) explains:
Housing element law recognizes the most critical decisions regarding housing development occur at the local level within the context of the periodically updated general plan. The RHNA Plan requires local governments to balance the need for growth (including the need for additional housing) against other competing local interests.
Fortunately, we have good metrics on how cities are doing. Unfortunately, the state still is failing to build enough despite all those reform bills. California’s 10 largest cities have issued building permits for about 159,000 homes against a combined state-assigned target of roughly 899,000. That’s just 18% (for only those cities).
The shortfall is far steeper for affordable housing. About 10% of the very-low and low-income allocation has been permitted, versus 29% for above-moderate-income units.
The following figures come from the state’s own tracker, the 6th Cycle RHNA Progress Report. HCD says the data is self-reported by cities and counties and not independently verified. Each city also started its eight-year clock at a different time, which matters when comparing them. Despite those caveats, the data give us a good snapshot.
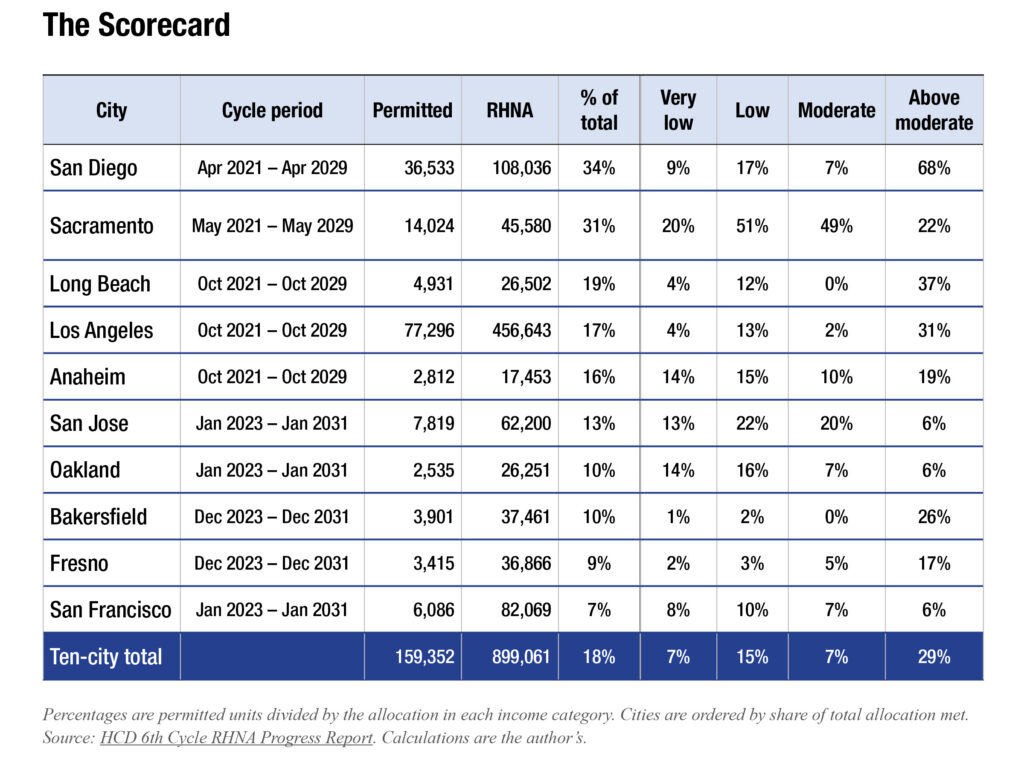
Percentages use state data for all 10 cities. I also reviewed four cities’ own reports, which in some cases differ from the state’s figures. San Diego’s and Fresno’s show higher permit counts, Sacramento’s measures one year’s output, and San Francisco’s analyst counts pipeline projects. Details below.
Although my analysis concentrates on the overall total, the income-tier columns to the right of the double lines show the “very low” category isn’t the only one lagging. Across the 10 cities, permits cover just 7% of the very-low-income target, 15% of low-income, 7% of moderate-income and 29% of above-moderate. That means moderate-income housing, aimed at middle-class earners, is as neglected as the poorest tier.
Next, we’ll look at two groups: leaders and laggards.
Leaders
San Diego scores the highest, meeting 34% overall of RHNA goals. Its “above moderate” number of 68% is the best for any category for any of the 10 cities, and brings up its overall average. But its “very low” category, at 9%, drags it down overall.
On Jan. 4, 2026, inewsource reported, “The city has permitted barely two-thirds of the homes it should have by now, based on long-term targets. And the existing rental supply is 97% full, records show, which keeps rents high.”
The city of San Diego’s Housing Element Annual Progress Report for 2025, an Excel spreadsheet, was uploaded in April 2026. It shows the city meeting 37.6% of its target, better than the state’s 34%. As noted above, the state doesn’t independently verify its data. In any case, the numbers are fairly close.
Sacramento came in second, scoring 31% of its RHNA goals. Its 20% for “very low” was the highest on the list. Its 22% for “above moderate” was below the 10-city average of 29%.
The city’s March 25, 2026 housing report found: “In 2025, the city produced 2,737 units, representing a 14.7% increase over 2024. This is approximately 48% of the 5,698 units that need to be built annually to meet the RHNA of 45,580 units over the eight-year planning period. A total of 930 affordable units were produced, and accessory dwelling units (ADUs) continued to increase, with 390 units permitted in 2025.”
Laggards
Fresno came in second-lowest. It met just 9% of its RHNA goal. Its “very low” share was 2% and its “low” share 3%, both second-lowest on the list, behind only Bakersfield’s 1% and 2%. “Above moderate” was 17%, fourth worst.
The state’s figures are a snapshot, and Fresno’s own count is higher. Its draft “2025 Housing Element Annual Progress Report,” dated March 2026, shows permits for 4,621 homes since mid-2023, counting a six-month projection period that the state credits toward the cycle. That is 12.5% of its 36,866-home target, which would lift Fresno out of the bottom group and put it roughly level with San Jose’s 13% in the state data. Lower-income housing still lags: the city reports permits for 563 very-low-income homes (6% of that target) and 191 low-income homes (3%), with six years of the eight-year cycle still to run.
San Francisco, San Francisco, enjoying an AI cornucopia beyond the dreams of avarice, finished last, meeting just 7% of its RHNA target. “Very low” was slightly better, at 8%. And “above moderate” was 6%, tied for lowest with San Jose and Oakland.
A June 5, 2026 report by the Board of Supervisors’ Budget and Legislative Analyst, “Financing Affordable Housing,” shows how the numbers differ depending on which count you use. It puts the city at about 12% of its 82,069-home target, or 9,581 homes. That figure covers homes “authorized or otherwise projected,” so it includes projects still in the pipeline and isn’t a count of permits issued.
By contrast, the state data, which count permits only, show 6,086 homes, or about 7%. The two numbers measure different things and shouldn’t be compared directly. Regardless of which number is used, the city that prides itself on leading the state’s progressive causes is not meeting its idealism with housing construction.
What’s Next?
The discrepancy between plans and construction is because RHNA is a planning requirement, not a building quota. The state requires each city to plan for its share of homes by zoning enough land and adopting policies to allow them. Whether homes actually get built depends on developers, financing and the market, which a city doesn’t control. As the Southern California Association of Governments explains, “RHNA does not necessarily encourage or promote growth, but rather allows communities to anticipate growth.”
In sum, cities zone for housing, but developers build it. Interest rates have been rising. Despite passing all those housing reform bills, land and construction costs remain high. Affordable units need subsidies that have dried up. And enforcement is weak. The crisis will continue.
John Seiler is on the editorial board of the Southern California News Group.